 Knapsack Pro
Run faster CI builds. Split tests evenly on parallel CI nodes using: Github Actions, Buildkite, Gitlab CI, CircleCI, Jenkins, and many more!
you have to wait 20 minutes for slow tests running too long on the red node
CI build completes work in only 10 minutes because Knapsack Pro ensures all parallel nodes finish work at a similar time
You can even run 20 parallel nodes to complete your CI build in 2 minutes
Step 1
Install Knapsack Pro client in your project
Step 2
Update your CI server config file to run tests in parallel with Knapsack Pro
Step 3
Run a CI build with parallel tests using Knapsack Pro

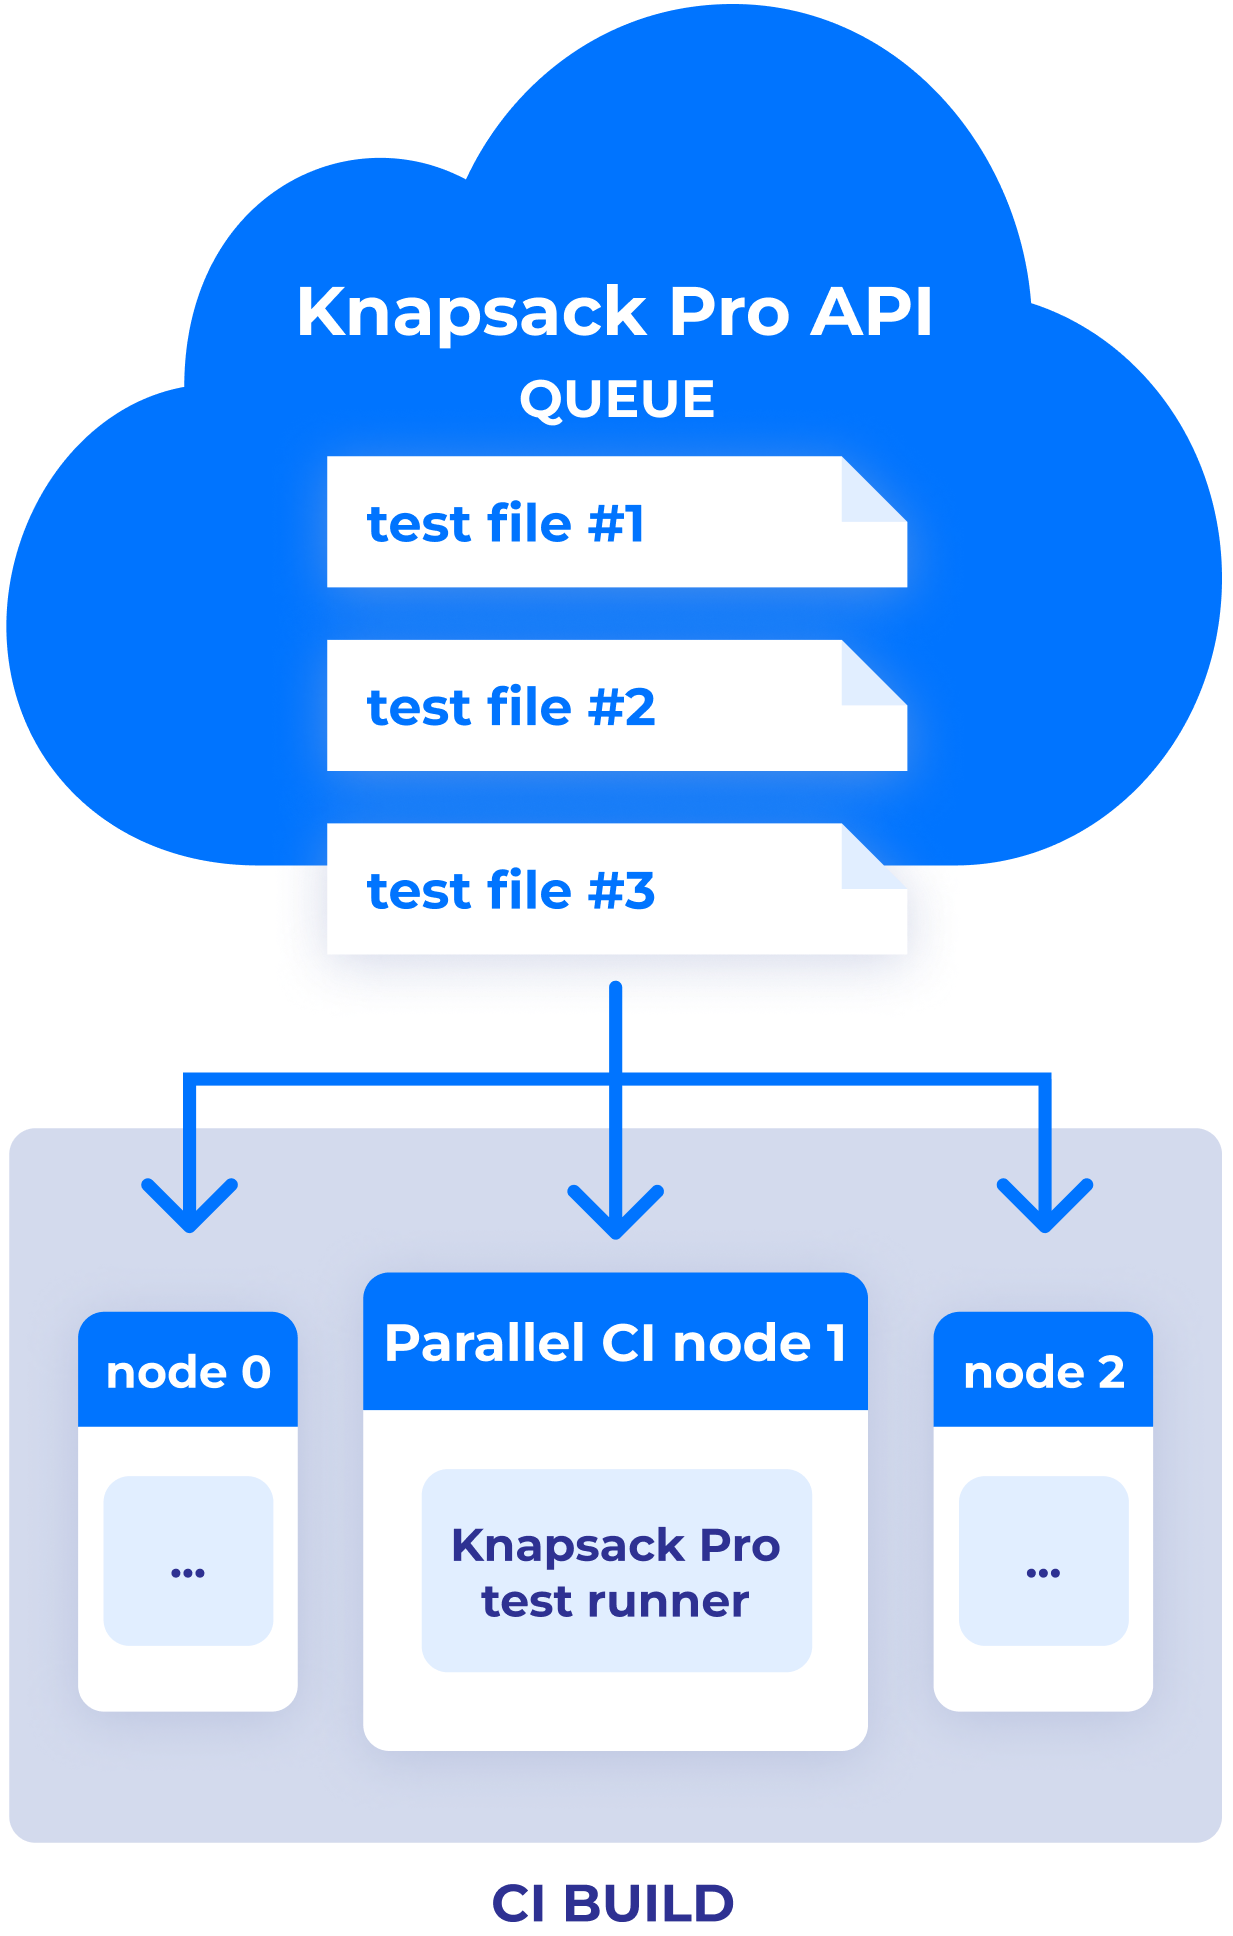
Knapsack Pro in Queue Mode splits tests in a dynamic way across parallel CI nodes to ensure each CI node finishes work at a similar time. Thanks to that, your CI build time is as fast as possible. It works with many supported CI servers.
| Programming Language | Supported test runners | Installation guide | Knapsack Pro Library README / Source |
|---|---|---|---|
| Ruby | RSpec, Cucumber, Minitest, test-unit, Spinach, Turnip | Install | knapsack_pro gem |
| JavaScript | Cypress.io | Install | @knapsack-pro/cypress |
| JavaScript | Jest | Install | @knapsack-pro/jest |
| JavaScript / TypeScript | Any test runner in JavaScript | How to build native integration with Knapsack Pro API to run tests in parallel for any test runner | @knapsack-pro/core |
| Any programming language | Any test runner | How to build a custom Knapsack Pro API client from scratch in any programming language | - |
Do you use other programming language or test runner? Let us know.
Join the teams optimizing their tests with Knapsack Pro.
We've been really enjoying Knapsack Pro, it's been saving us a ton of time.
My team at @GustoHQ recently added @KnapsackPro to our CI. It's pretty sweet... It makes your builds faster _and_ (this is almost the better bit) more consistent! Thank you for the awesome tool!
— Stephan Hagemann (@shageman) September 26, 2022
This is a fantastic product, it's been a total game-changer for us.
We are using CircleCI and we noticed that builds were being limited by the slowest parallelized container. Knapsack Pro was really east to setup and we saw huge improvements right away. Thank you for making this tool!
🛠 How to run 7 hours of tests in 4 minutes using 100 parallel Buildkite agents and @KnapsackPro’s queue mode: https://t.co/zbXMIyNN8z
— Buildkite (@buildkite) March 29, 2017
Knapsack Pro has helped us build an insanely fast and scalable build pipeline with almost no setup or maintenance.
Knapsack Pro saves us hours of engineer waiting time every week, and is the best solution for keeping our tests load balanced that we've used to date.
I've been playing with Queue Mode. Love it! Wow, I love how fast it goes.
Awesome to see @NASA speeds up tests with #knapsack gem in https://t.co/GFOVW22dJn project! https://t.co/2GGbvnbQ7a #ruby #parallelisation
— KnapsackPro (@KnapsackPro) April 6, 2017
I just logged into my account expecting it to say that I needed to add a credit card and was so surprised and delighted to see the trial doesn't count usage by calendar days but by testing days! This is incredible! I love it!!!
I just wanted to say that I really appreciate that small but very huge feature. Thank you for being so thoughtful :)
Dynamic tests allocation across CI nodes. It ensures all parallel CI nodes finish work at a similar time to get the fastest CI build time.
Queue Mode solves CI node bottlenecks impacting your parallel tests split:
Test suite split based on time execution. Generates subset of test suite per CI node before running tests.
Network issues? Not a problem, run tests anyway! Auto switch to the fallback mode to not depend on Knapsack Pro API.
A single slow RSpec test file can be auto split by test examples between parallel jobs
Ruby: RSpec, Minitest, Test::Unit, Cucumber, Spinach, Turnip.
JavaScript: Cypress.io, Jest
API: Use native integration with Knapsack Pro API to run tests in parallel for any test runner
Other languages: How to build a custom Knapsack Pro API client from scratch in any programming language
Do you use different programming language or test runner? Let us know in the poll
Monthly you can save hours
and up to $
on faster development cycle.